Snowfall Statistics & Weather
| Season | Season Snowfall Total | Sept/Oct | Nov | Dec | Jan | Feb | Mar | Apr |
|---|---|---|---|---|---|---|---|---|
| 2024-25 | 541 as of Mar. 23 | 17 | 123 | 124 | 40 | 102 | 135 as of Mar. 23 | |
| 2023-24 | 508 | 6 | 33 | 91 | 97 | 96 | 129 | 56 |
| 2022-23 | 617 | 16 | 75 | 135 | 81 | 126 | 103 | 81 |
| 2021-22 | 648 | 12 | 59 | 189 | 93 | 74 | 93 | 128 |
| 2020-21 | 704 | 8 | 122 | 142 | 155 | 133 | 104 | 40 |
| 2019-20 | 686 | 13 | 22 | 90 | 294 | 115 | 129 | 23 |
| 2018-19 | 538 | 5 | 31 | 205 | 90 | 130 | 36 | 41 |
| 2017-18 | 844 | 15 | 126 | 125 | 225 | 156 | 111 | 86 |
| 2016-17 | 866 | 5 | 115 | 207 | 70 | 133 | 269 | 67 |
| 2015-16 | 622 | 0 | 94 | 186 | 103 | 109.5 | 114.5 | 15 |
| 2014-15 | 303 | 21 | 41 | 83 | 48 | 18.5 | 42.5 | 49 |
| 2013-14 | 623 | 40 | 46 | 66 | 87 | 157.5 | 164 | 62.5 |
| 2012-13 | 740 | 21 | 84 | 251 | 119 | 110 | 103 | 52 |
| 2011-12 | 808 | 0 | 147 | 47 | 197 | 126 | 260 | 31 |
| 2010-11 | 857 | 0 | 103 | 176 | 109 | 118 | 227 | 124 |
| Season | Snowfall Total | Season | Snowfall Total | |
|---|---|---|---|---|
| 2009-10 | 644 | 1999-2000 | 748 | |
| 2008-09 | 548 | 1998-99 | 1,140* | |
| 2007-08 | 786 | 1997-98 | 648 | |
| 2006-07 | 660 | 1996-97 | 776 | |
| 2005-06 | 805 | 1995-96 | 439 | |
| 2004-05 | 464 | 1994-95 | 542 | |
| 2003-04 | 633 | 1993-94 | 531 | |
| 2002-03 | 587 | 1992-93 | 399 | |
| 2001-02 | 800 | 1991-92 | 373 | |
| 2000-01 | 449 | 1990-91 | 607 |
| Season | Snowfall Total | Season | Snowfall Total | |
|---|---|---|---|---|
| 1989-90 | 582 | 1979-80 | 527 | |
| 1988-89 | 627 | 1978-79 | 510 | |
| 1987-88 | 723 | 1977-78 | 471 | |
| 1986-87 | 502 | 1976-77 | 373 | |
| 1985-86 | 522 | 1975-76 | 795 | |
| 1984-85 | 753 | 1974-75 | 825 | |
| 1983-84 | 595 | 1973-74 | 958 | |
| 1982-83 | 657 | 1972-73 | 612 | |
| 1981-82 | 819 | 1971-72 | 1,008 | |
| 1980-81 | 277 | 1970-71 | 1,063 |
*1998-99 World Record Snowfall
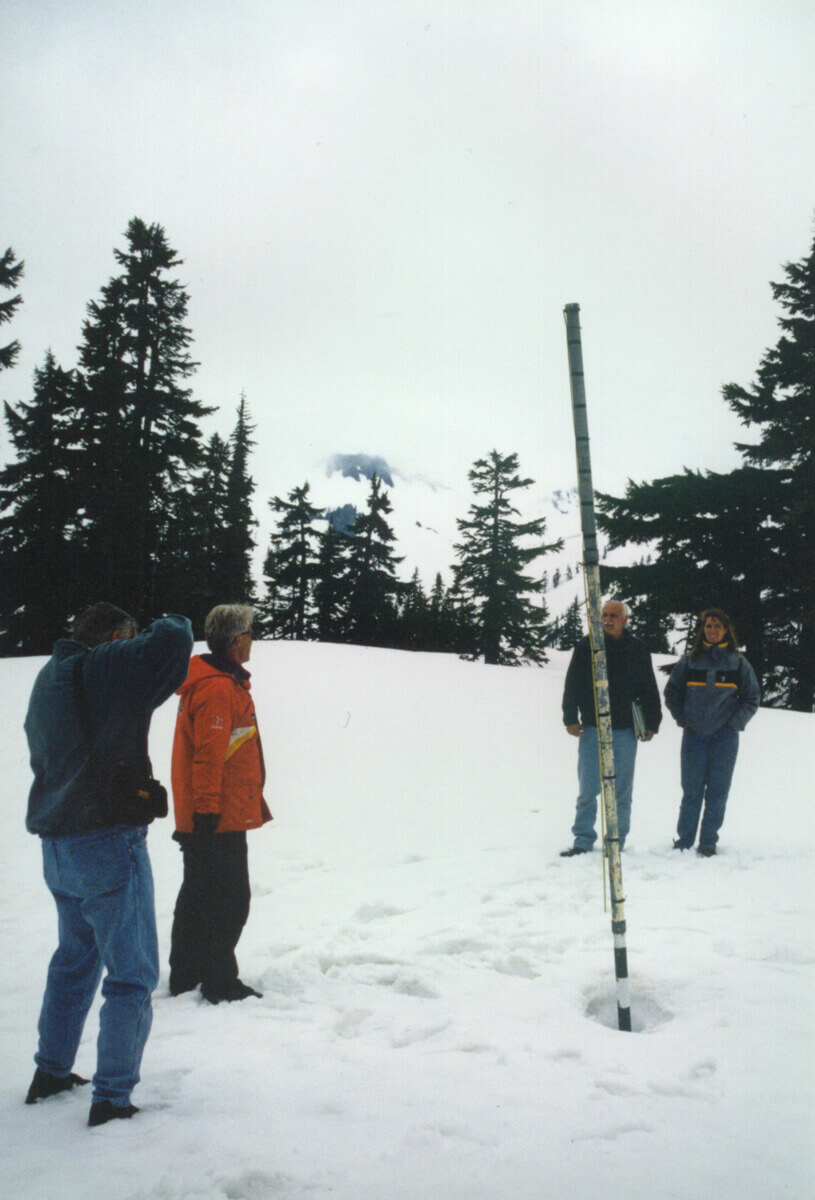
During the winter of 1998-99 Mt. Baker received 1,140 inches of snowfall – verified by NOAA as the World Record of snowfall during a single winter season!
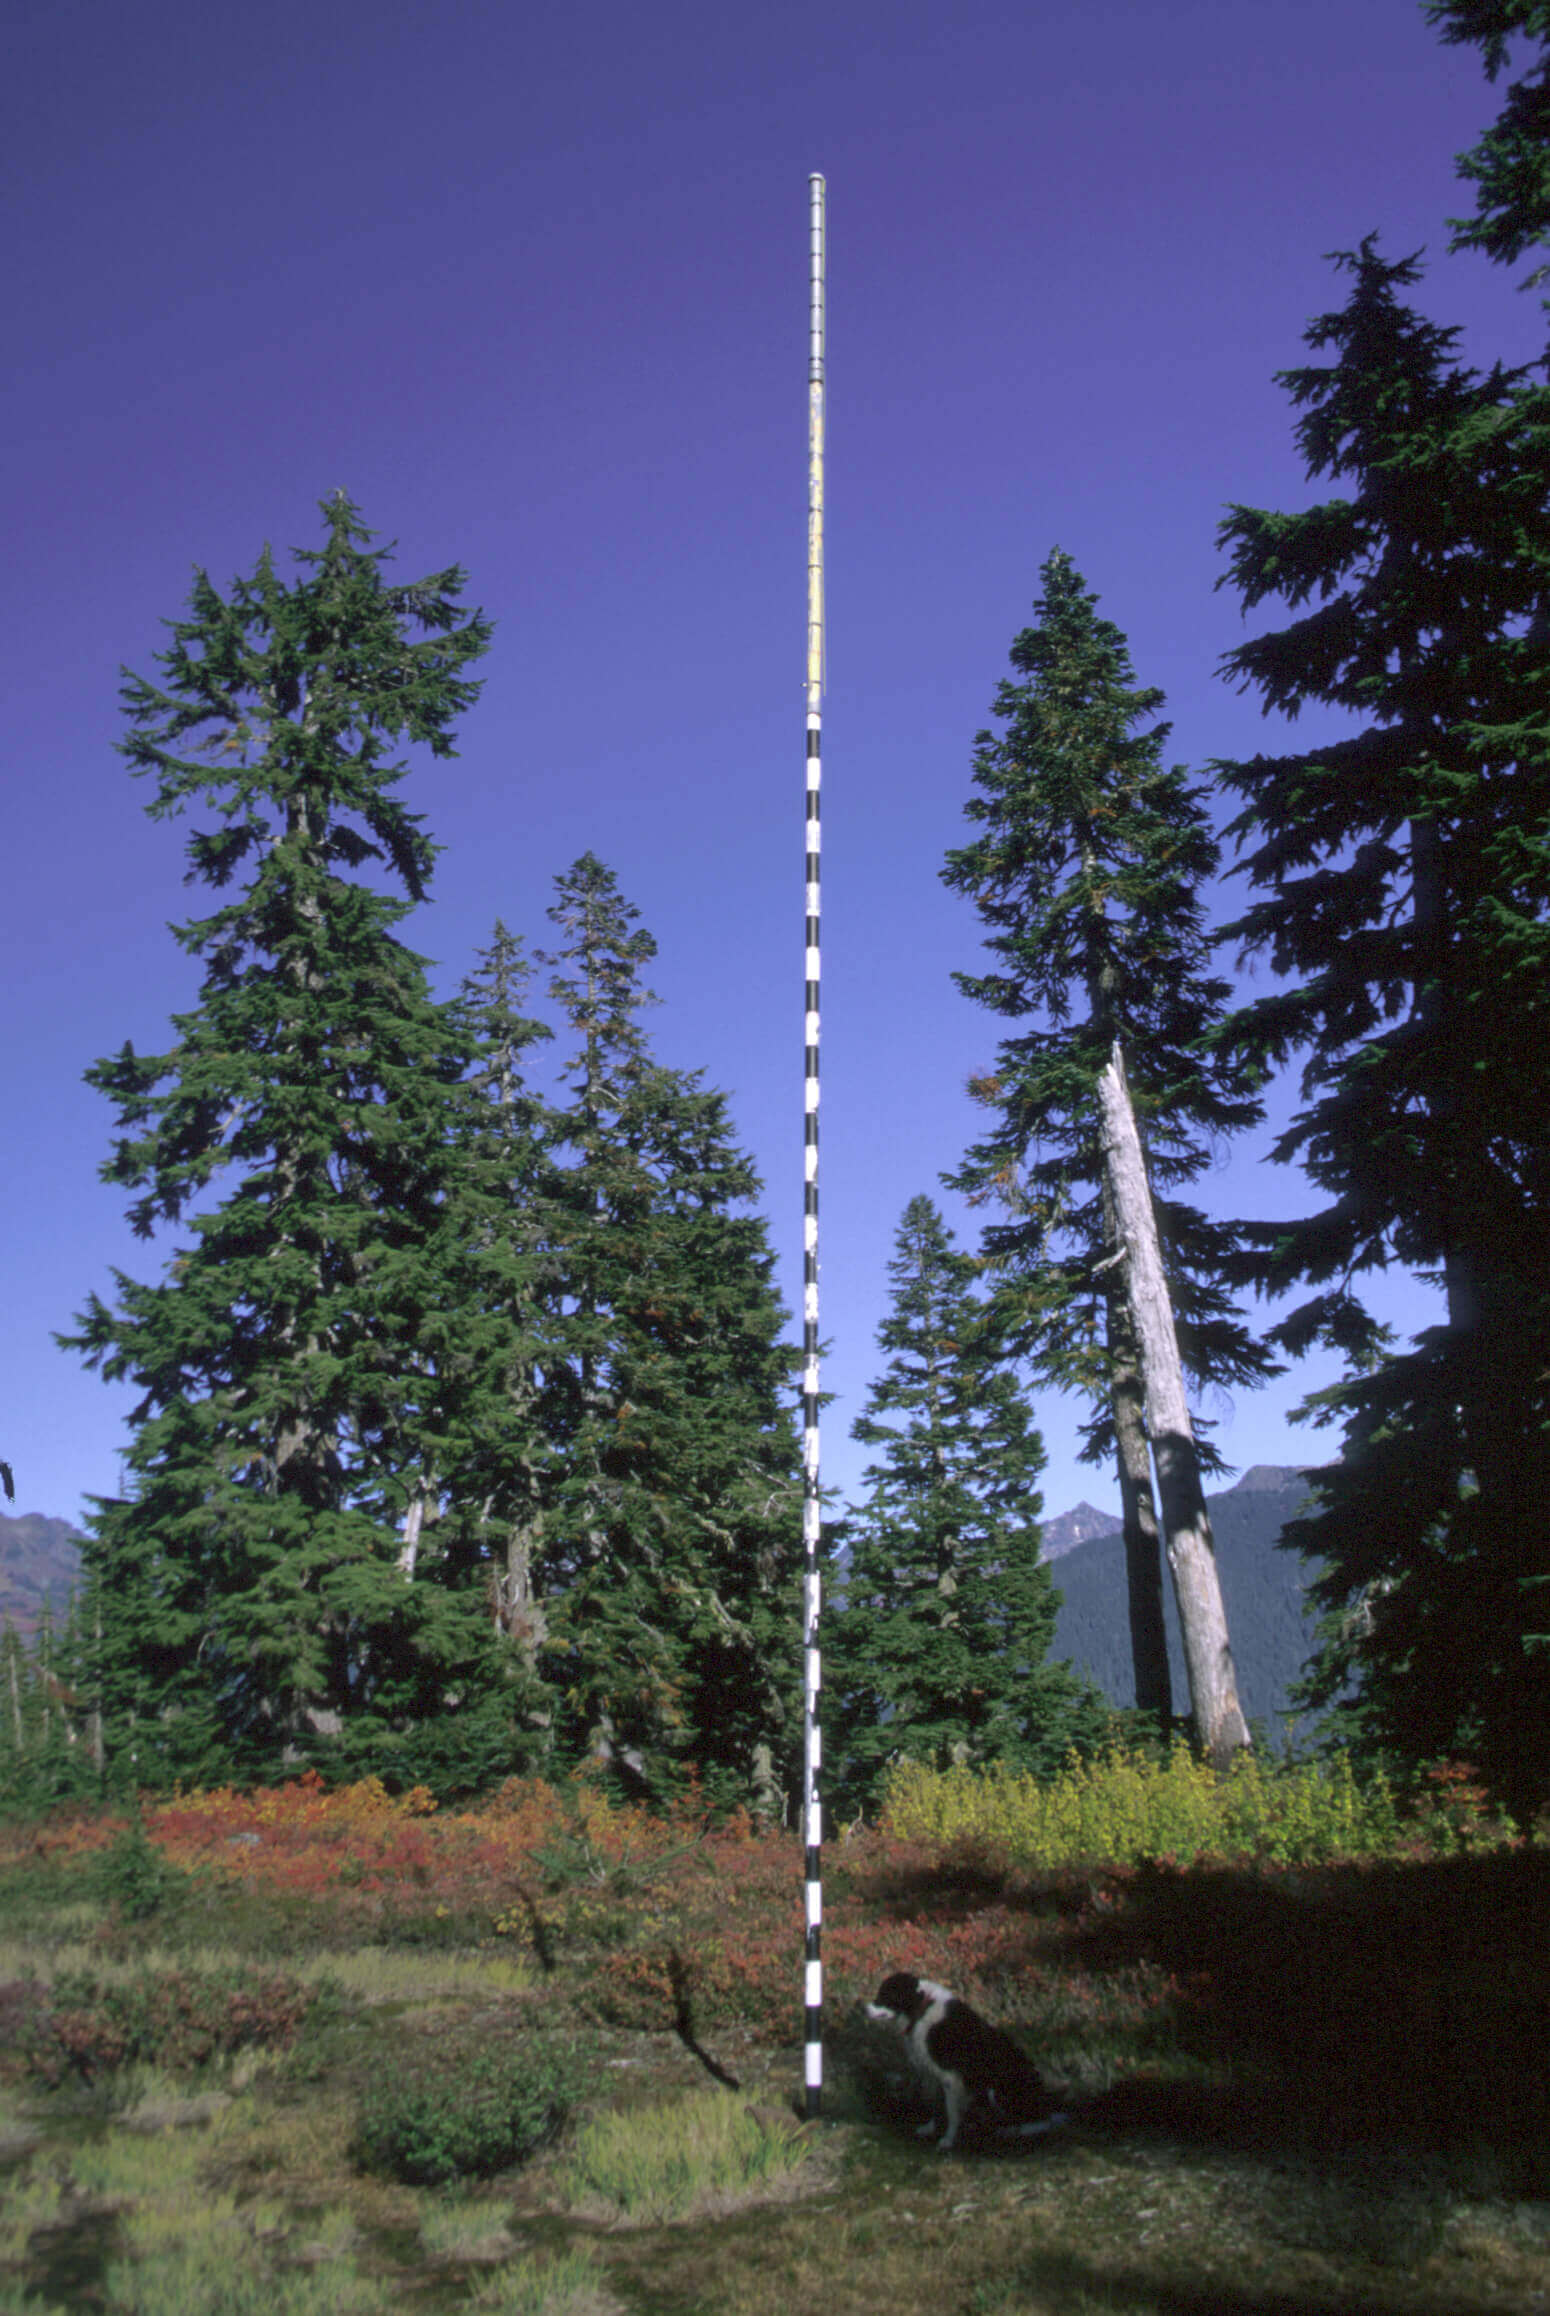
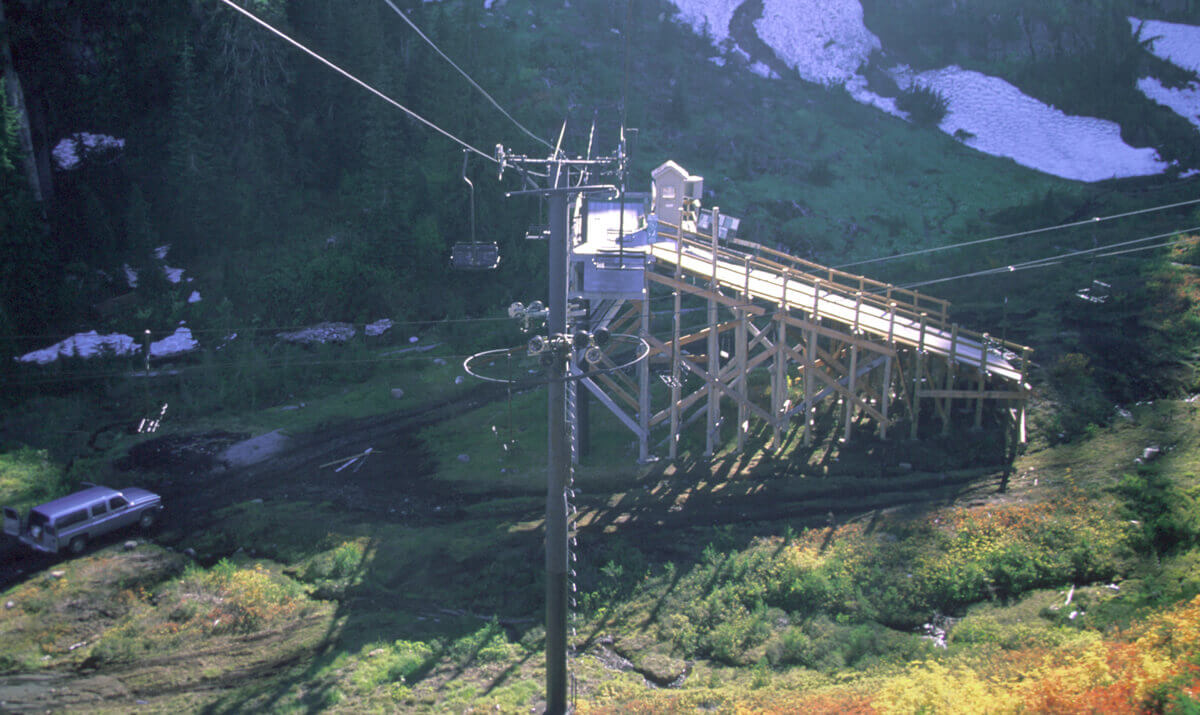
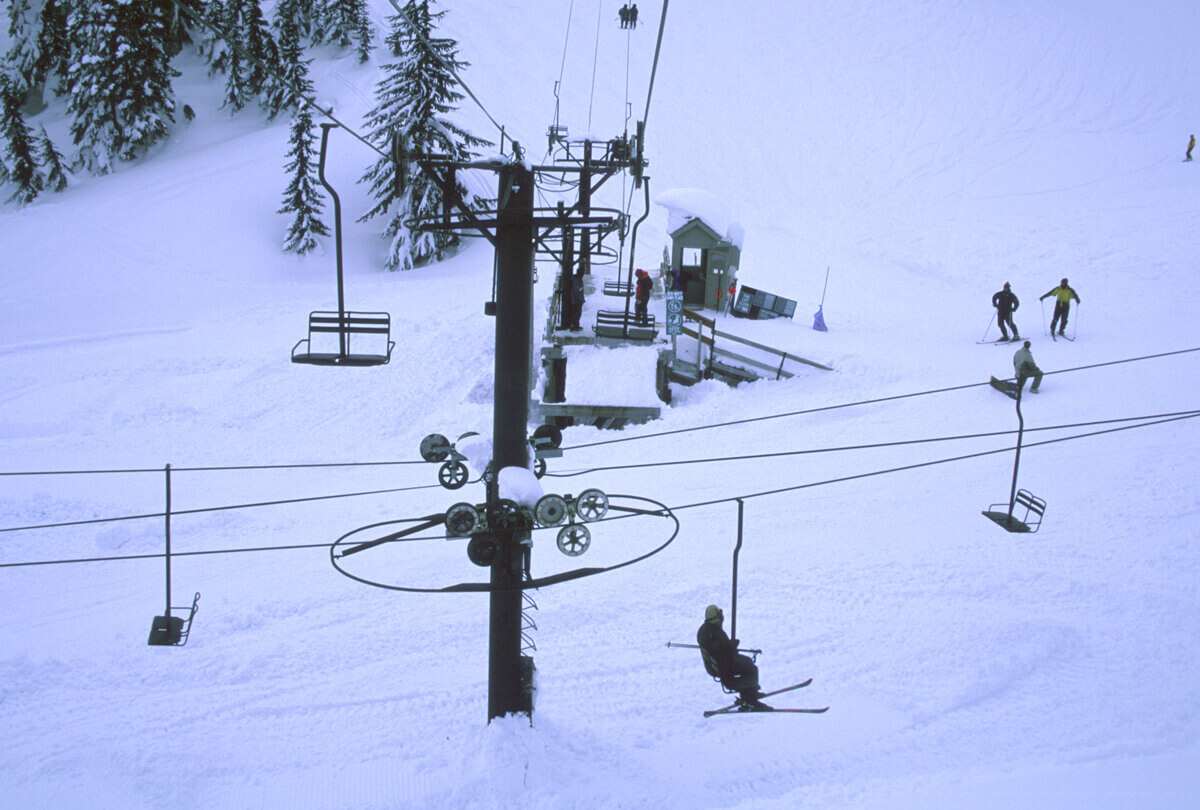
The images below show the snowfall stake in summer, then in spring of 1998-99 with NOAA officials verifying the record. The other images show Chair #1 midstation loading ramp during summer and then March of 1999. (Yes, that’s our old ramp, prior to the rebuild. We had a few black diamond ramps back in the old days)
Hey, Snow People … ready for some beautiful graphics? Check out the Dec-Jan-Feb outlook from NOAA below!!! Zoom in and you’ll see the prediction for TEMPERATURES to be leaning BELOW normal and PRECIPITATION to be likely ABOVE normal … and that would translate to SNOW. At this point forecasts are calling for an emerging La Nina that could be similar to the 2016-17 season – scroll down to the snowfall stats to see the snowfall from that season.
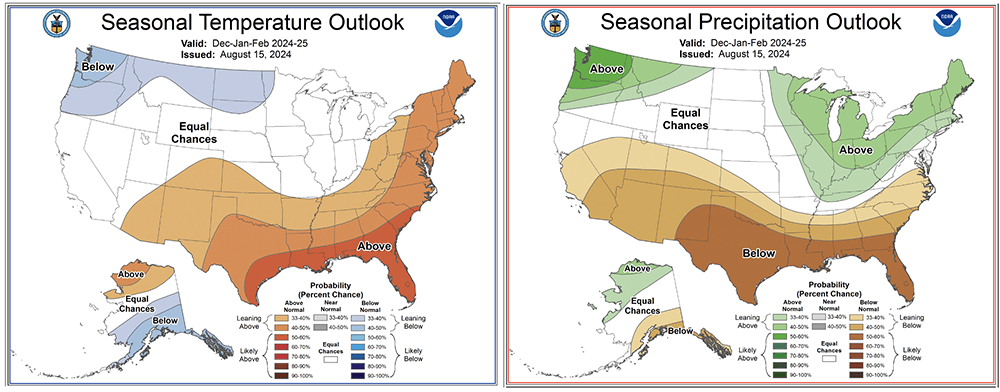
The long range forecast predictions are arriving from the big meteorological entities and we are seeing some verrrry promising info. Check your favorite forecasts for updates, and click through the links below to view full info from :
• NOAA Climate Predictions for Dec-Jan-Feb
• NOAA Climate Predictions for Jan-Feb-Mar
• OpenSnow season La Nina Analysis
• OpenSnow Winter Forecast Preview
• Freeskier Analysis of NOAA forecast
